
How to Look Up Montgomery County Jail Population Data
The best official source for the current count is the live jail roster run by the county. The roster table at the Montgomery County jail roster lists the facility code MONT-JAIL and shows a live population figure. That figure updates every 30 minutes. So the number you see is a point-in-time count, not a daily average. For roster questions, the jail information line is 937-225-4160.
Read the roster count as a snapshot. On May 26, 2026, the MONT-JAIL population read 531. Earlier May 2026 snapshots from the same official roster showed values near 478 to 481. That swing is normal. People bond out, get sentenced, or move to court all day long. None of those numbers is "wrong"; each is just the count at that minute.
For aggregate data that goes beyond today's count, the picture gets thinner. The county does not publish a tidy public dashboard with capacity, average daily population, or demographics. To go deeper, you turn to the Sheriff's annual reports, county budget PDFs, Ohio jail inspection reports, and national datasets. Those sources are named in the sections below. Each one answers a different question, and none of them replaces the live roster for "how many people are in jail right now."
Montgomery County Jail Capacity Overview
The county runs one main jail. It sits at 330/345 W. Second Street in downtown Dayton and is listed on the roster as MONT-JAIL. The live population there read 531 on May 26, 2026. Capacity is the harder figure. An official rated bed count was not found in the sources captured for this site, so the table below marks that cell honestly rather than guessing.
| Facility | Rated Capacity | Current Population |
|---|---|---|
| Montgomery County Jail (MONT-JAIL), Dayton, OH | Not officially published in sources reviewed | 531 (roster, May 26, 2026; updates every 30 min) |
To pin down the rated capacity, the records to check are the Ohio Department of Rehabilitation and Correction jail inspection reports and the county's own budget documents. Those filings usually state a bed count and note crowding when it happens. Until then, the honest read is this: the jail holds several hundred people, the live count is the only firm number, and the official cap is a research gap. Note: a roster count above an unstated cap does not by itself prove crowding, since rated capacity and operating capacity can differ.
Average Daily Population
Average daily population, often shortened to ADP, is the mean number of people in custody across a full year. It smooths out the daily swings the roster shows. A single roster reading of 531 is not an ADP. It is one moment. ADP would average every day of the year into one figure.
An official Montgomery County ADP, along with a five-year ADP trend, was not located in the sources captured for this site. That is a real data gap, and it is worth stating plainly rather than filling with a made-up number. The places that would carry it are the Montgomery County Sheriff's annual report and the county budget. Both often print a year-by-year ADP table tied to jail staffing and food and medical costs. The Bureau of Justice Statistics also estimates ADP at the state and national level, which gives a yardstick even when the county figure is missing.
Demographic Breakdown
A demographic breakdown splits the jail population by gender, race, and age. It answers who is held, not just how many. The live roster lists each person, but it does not publish a tidy summary by group. A county-level breakdown of the Montgomery County inmate population was not found in the official sources reviewed here.
| Group | Percent of Population |
|---|---|
| By gender (male / female) | Not published in county sources reviewed |
| By race / ethnicity | Not published in county sources reviewed |
| By age group | Not published in county sources reviewed |
The table marks each row as a gap on purpose. To fill it, the Sheriff's annual report is the first stop, since many sheriffs print a yearly booking summary by gender and race. Prison Policy Initiative and the Bureau of Justice Statistics also publish demographic patterns at the state and national level. Those national figures are not Montgomery County numbers, and the table makes that line clear. They show the shape of the trend, not the local count.
Pretrial vs. Sentenced Population
Jails hold two main groups. One group is pretrial. These people have been charged but not convicted, and many are held because they have not posted bond. The other group is sentenced. They have been convicted and are serving a jail term, usually for a misdemeanor or a short felony sentence. The split between the two drives a lot of the population total.
| Status | Percent |
|---|---|
| Pretrial (charged, not convicted) | Not published for Montgomery County in sources reviewed |
| Sentenced (convicted, serving time) | Not published for Montgomery County in sources reviewed |
The exact local ratio was not found in official county sources, so the table says so. National data from the Bureau of Justice Statistics has long shown that most people in local jails are held pretrial rather than sentenced. That is a national pattern, not a confirmed Montgomery County figure. Bond amounts matter here too. Ohio House Bill 1 added a bail surcharge that can run as high as $85 per bond, which sits on top of the bond and court costs and can shape who stays in and who gets out.
Misdemeanor vs. Felony Population
Another way to split the count is by charge level. Misdemeanors are lower-level offenses, often heard in Municipal Court. Felonies are serious charges that move through the Court of Common Pleas General Division. The jail holds both: people awaiting felony trial, people serving short misdemeanor terms, and people held on a mix of charges.
A clean misdemeanor-versus-felony split for the Montgomery County jail population was not found in the official sources reviewed. It is a research gap, not a settled number. The Sheriff's booking data and the Clerk of Courts case data would together show the charge mix, but neither was captured as a ready-made breakdown. One thing worth knowing is that not every sentenced person sits in a bed. The county runs population-management programs that move some sentenced people out of full-time custody, which the next sections and the trends section both touch on.
Mental Health and Medical Population
Some people in the jail need mental health care or medical care. Tracking that share matters because care needs drive staffing and cost. The county does not publish a public figure for how much of the Montgomery County inmate population gets mental health or medical treatment, and that number was not located in the sources reviewed here.
What the official program pages do show is a set of in-jail programs that touch health and behavior. These include substance-use programming, anger-control and domestic-violence classes, health programming, self-esteem and literacy classes, computer classes, and worship services. The county also runs a Day Reporting Program, an Inmate Work Program, and volunteer programs. These do not give a medical census, but they show the jail handles more than just holding people. Note: medical and mental health staffing ratios were not found in official sources and would need to come from the Sheriff's reports or the county budget.
National and State Context
When local figures are thin, state and national data give a frame. The Bureau of Justice Statistics is the federal agency that counts jail and prison populations across the country. Its jail reports publish a national jail incarceration rate per 100,000 residents and break it down by state. You can read those reports at the Bureau of Justice Statistics site, which is the standard reference for jail population trends.
The Bureau of Justice Statistics page is the best starting point for understanding how local jail counts compare nationwide.
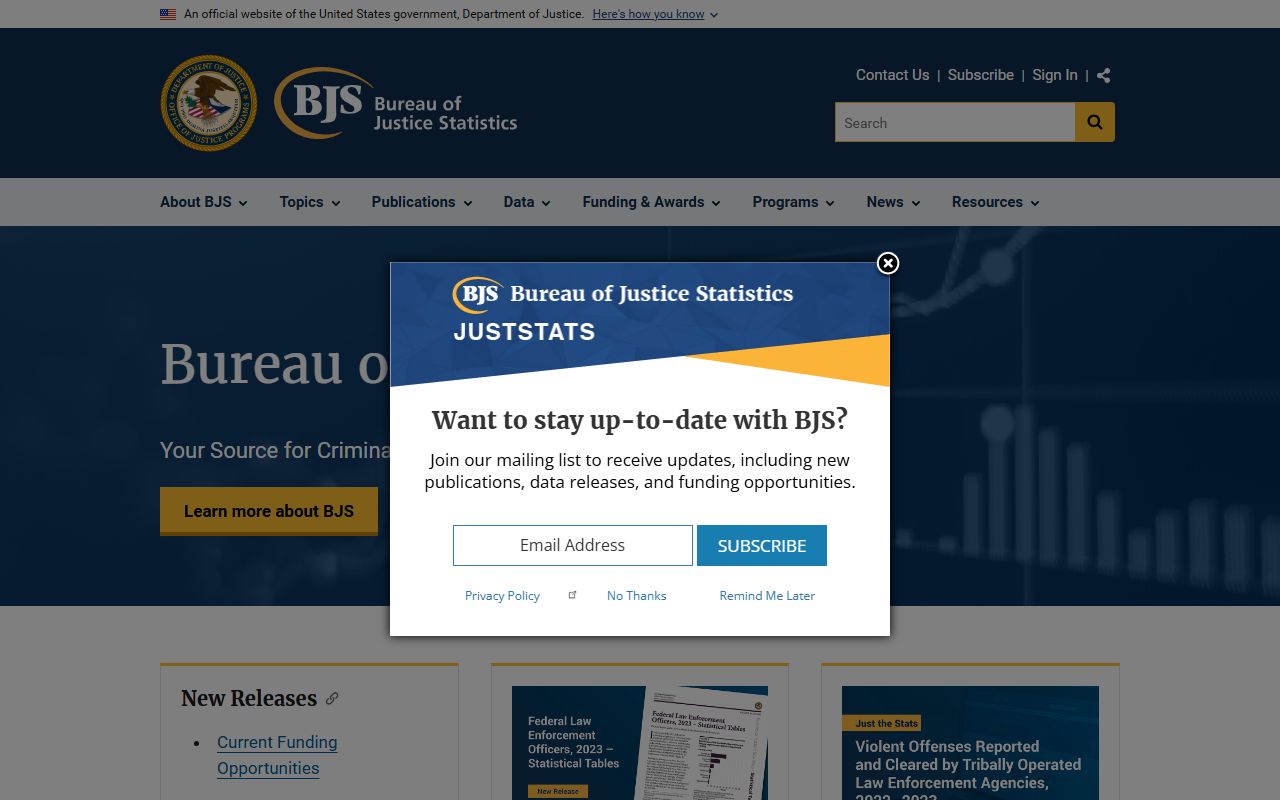
The screenshot shows the federal data hub where national and state jail population rates are posted. The comparison table below sets the county next to the state and the nation. The key point is which numbers are local and which are not. The county rate per 100,000 is a research gap; the state and national rates are published by federal sources and are not Montgomery County figures.
| Level | Jail Population per 100k |
|---|---|
| Montgomery County (county-specific) | Not published in sources reviewed (research gap) |
| Ohio (state figure, not county) | See Bureau of Justice Statistics state tables |
| National (U.S. figure, not county) | See Bureau of Justice Statistics national jail reports |
Prison Policy Initiative is a second source worth using for context. It pulls federal data into clear state profiles and charts. Its work on Ohio incarceration is posted at the Prison Policy Initiative site, which is helpful for seeing how the state's rates have moved.
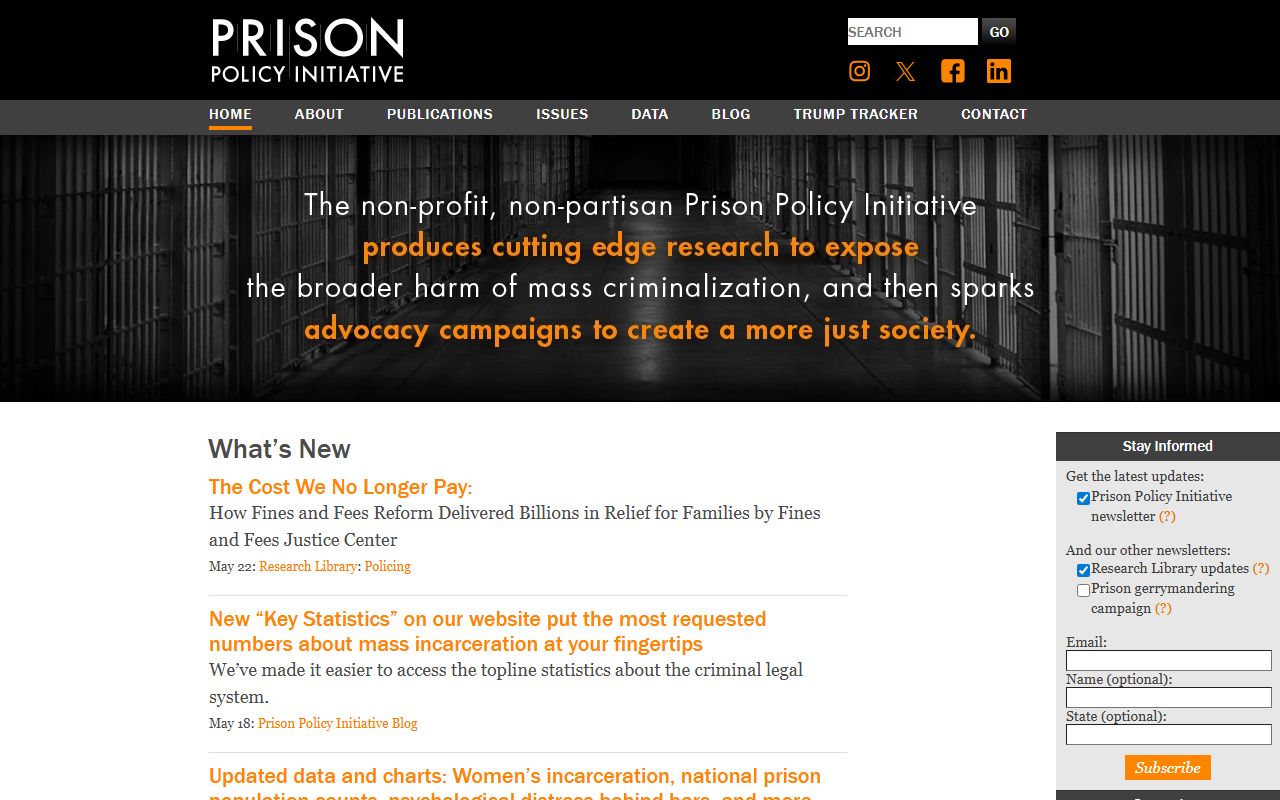
That page rounds out the national picture and helps put any future Montgomery County figure in scale. Read both sources as context, not as a stand-in for the local count, which still comes from the live roster.
Population Trends Over Time
Trends show whether the jail count is rising, falling, or holding steady across years. A single roster reading cannot show a trend. You need a run of figures, usually the yearly ADP, to see direction. An official five-year Montgomery County trend line was not found in the sources reviewed, so the honest answer is that the long-run local trend is a gap to be filled from the Sheriff's reports and county budgets.
That said, the short-run movement is visible right now. Within May 2026 alone, the roster ran from roughly 478 up to 531. That is the day-to-day churn, not a yearly trend, but it shows the count is live and moving. Programs that ease bed pressure also bend the trend. The Day Reporting Program screens nonviolent sentenced offenders for daily reporting and community service instead of a jail bed. Add court speed, bond practice, and sentencing patterns, and you have the main levers behind any multi-year change.
- Day Reporting Program, which moves screened nonviolent sentenced offenders into daily reporting instead of full custody.
- Inmate Work Program, with in-jail and outside work details.
- Volunteer programs covering substance use, anger control, literacy, and more.
For state and national trend lines while the local series is missing, the Bureau of Justice Statistics and Prison Policy Initiative both publish multi-year charts.
Searching for Montgomery County Inmate Records by Name
This page covers aggregate jail population data, not a single person. To look up one person by name and see booking date, charges, and bond, use the live jail roster through Montgomery County inmate records. That page handles name-based searches; to find someone after they leave custody, see released inmates.
Where the Data Comes From
The numbers on this page trace back to a short list of sources, and it helps to know which one answers which question. The live count comes from the county roster. The wider context comes from federal datasets. The gaps would be filled by Sheriff and county filings. The table sorts them out.
| Source | What It Provides |
|---|---|
| Montgomery County jail roster (MONT-JAIL) | Live point-in-time population, updated every 30 minutes |
| Sheriff's annual reports and county budget PDFs | ADP, staffing, and cost figures (where published) |
| Ohio jail inspection reports | Rated capacity and crowding notes |
| Bureau of Justice Statistics | State and national jail rates per 100,000 |
| Prison Policy Initiative | Ohio context and multi-year charts |
For the live count, go to the county jail roster; the jail line is 937-225-4160. For national and state context, use the Bureau of Justice Statistics and Prison Policy Initiative. If you are chasing a charge or a case behind a booking, the arrest records page and the warrant records page point to the court and Sheriff tools that show why a person is being held.